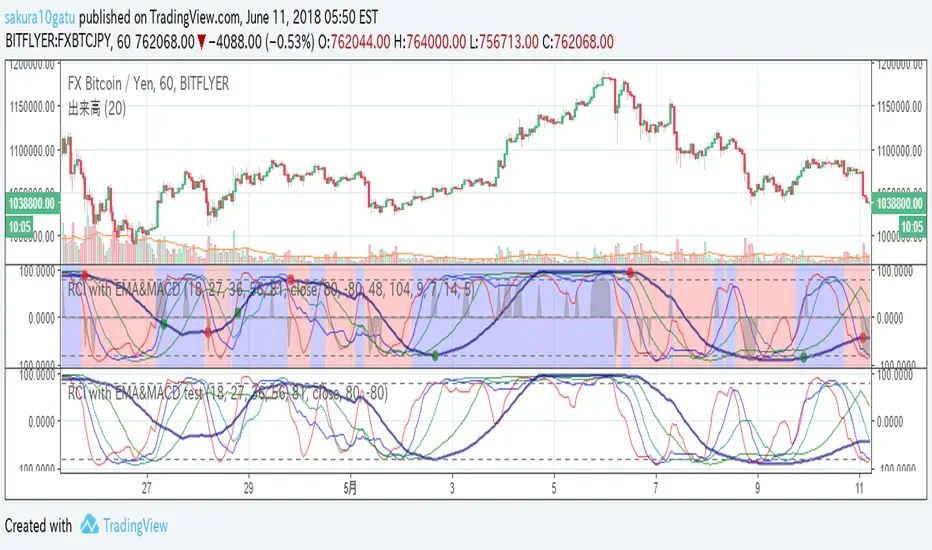
RCI with EMA&MACD2018/6/11 Re-release for house rule of Trading view.
5lines : RCI lines. A thick navy line has the longest period.
circles : MACD cross. GC=green DC=red
backcolor : Short EMA > Long EMA is blue. Short EMA < Long EMA is red.
Black shadow : It reveals its appearance when over-buying/selling.
It helps your entry.
Search in scripts for "Buy sell"
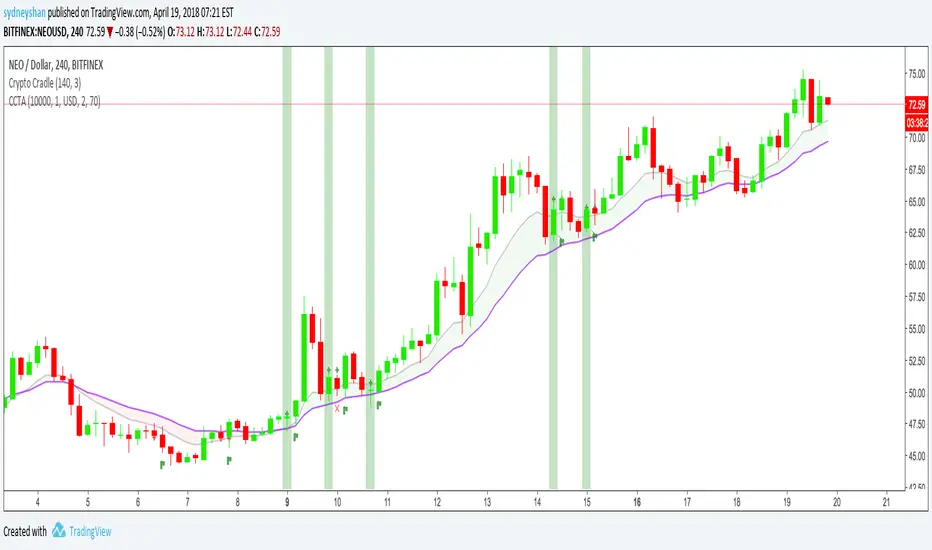
Crypto Cradle Trade AssistantThis indicator compliments the Crypto Cradle indicator by providing your entry, stop, 1:1 scale-out price, trade amount, and potential profit based on your target and scale-out strategy.
1. Ensure you have added the Crypto Cradle and Crypto Cradle Trade Assistant indicators to your chart
2. Click the cog icon to configure this indicator
3. Enter in your account balance and the % you are willing to risk on this trade (default: 1%).
3. Set your target price
4. Tweak the Trade Pair and Precision (Decimals) if required (USD/USDT only BTC & ETH coming soon)
5. Click on the 'Data Window' icon on the right-hand side of the screen and scroll down to CCTA
6. Hover over a highlighted crypto cradle candle (green for long, red for short) and a series of values will appear
Entry price
Stop price
1:1 scale out price
Amount to buy/sell (ie NEO)
Amount in traded currency (ie USD)
Target price (that you set)
Profit based on selling 50% of your bought amount when your reward equals your risk (1:1 scale-out)
Profit based on risking 1% of your portfolio
For more about the Crypto Cradle strategy, visit www.tradercobb.com

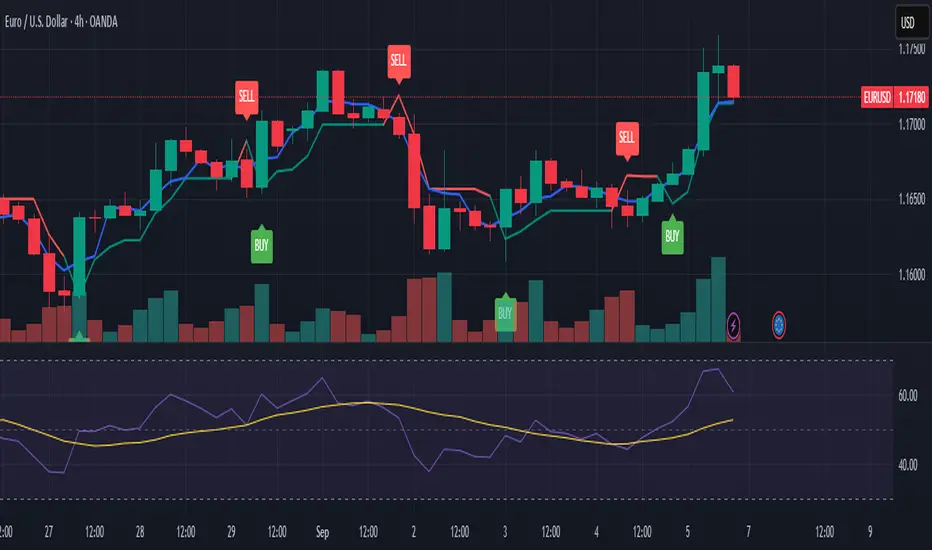
Volume Based Price ActionThis indicator is uses volume and common candlestick patterns to suggest potential trend reversals. It is not quite meant to be used as a buy/sell signal. Instead, it should be used to evaluate market psychology based on when the buyers or sellers fully dominated the price action.
In the current version, the indicators looks for engulfing and pin-bar patterns. Optionally, it also considers rising volume as further confirmation to the signal. In future, I plan on allowing it to track more candlestick patterns.
Please let me know if you have any suggestions, concerns, or comments!

Candlestick Trend Indicator v0.5 by JustUncleLRequested Update to this Indicator alert project. In this update I have added the option to be able select which Price Action candles you want included in the display and the generated alarm Alert. Other changes also included in this update:
Also added a Price Action candle for "Last Fractal S/R Break", this also a good continuation indication.
Added option to select a different moving average types for directional MA line.
Modified some default settings, using HullMA instead of Zero Lag EMA and standard MACD settings(12,26,9).
Description:
This is a trend following indicator and alert for Binary Options based on Candlestick patterns and trend line -
NOTE: original system was a forex trading system.
This code combines a number of indicators to create an overall trading strategy.
The indicator recognises and displays some useful candle named defined patterns that are used to support trend continuation:
Bearish + Bullish PinBars
Dark Cloud Cover
Piecing Line
Bullish + Bearish Harami
Bullish + Bearish Engulfing Candle
Bullish + Bearish Last Fractal S/R break
Also recognises main Price Action candles from ChrisMoody (CM), the four(4) price action patterns are colored coded bars:
Yellow = Inside Bar - breakout/continuance
Orange = Outside Bar - breakout/continuance
Aqua/Fuschia = Up/Down Shaved Bars - Buying/Selling pressure
Red/Green = Possible reversal PinBars - Reverse Down / reverse Up
The highlighted candles (maroon and darker green) represent the defined PA patterns that have been confirmed following the current trend direction that is indicated by the Hull MA(20) line (can select a different type of MA, or even disable) and confirmed by MACD direction (can be disabled). The confirmed Alerts are indication by green (buy) and red (sell) dots at the bottom of the chart. An alert is generated from this selection for the alert condition of the alarming system.
The fractal upper/lower break lines are also draw, if the (optional) last fractal break line is broken by a highlighted bar then this indicates a stronger trend conformation.
The MACD indicator MACD DEUTER 2 colour(12,26,9) you can visually see the MACD histogram colours with MACD direction - needs "MACD DEUTER 2 colour" indicator.
This multi-indicator set up is suitable for 1hr, 4hr and daily charts with 1-4 candle expiry.
References and Inspiration from:
Fractal Levels by RicardoSantos
Almost Zero Lag EMA
Candlestick Patterns With EMA by rmwaddelljr
CM_Price-Action-Bars by ChrisMoody
www.forexstrategiesresources.com
"Scalp Jockey - MTF MA Cross Visual Strategizer by JayRogers"

QQE Cross Indicator Alert v2.0 by JustUncleLThis version of the indicator makes a distinction between the types of QQE cross alerts on the chart and now only recommends the Thresh Hold channel exit crosses for BUY/SELL alerts, the other two types of crosses are still there to provide pre-warning of pending BUY/SELL alerts. Also only the BUY/SELL alerts are filtered by Moving Average Filter and/or the new Directional filter (default). The default settings in this version have also been changed, particularly the Moving Averages, to indicate trend changes quicker.
Indicator Project Description:
*** This is a trend following indicator alert that uses fast QQE crosses with Moving Averages for trend direction filtering. QQE or Qualitative Quantitative Estimation is based on the relative strength index, but uses a smoothing technique as an additional transformation. Three crosses can be selected (all selected by default):
RSI signal crossing ZERO (XZERO)
RSI signal crossing Fast RSIatr line (XQQE)
RSI signal exiting the RSI Threshhold Channel (BUY/SELL)
The (BUY/SELL) alerts can be optionally filtered by the Moving Average Combo:
For BUY alert the Close must be above the fast MA and
fast MA (EMA8) > medium MA (EMA20) > slow MA (SMA50).
For SELL alert the Close must be below the fast MA and
fast MA (EMA8) < medium MA (EMA20) < slow MA (SMA50).
and/or Directional filter (default filter):
For BUY alert the Close must be above the slow MA (SMA50) and the directional MA (EMA20) must be green.
For SELL alert the Close must be below the slow MA (SMA50) and the directional MA (EMA20) must be red.
The XZERO and XQQE are not included in the filtering, they are used to indicate pending BUY/SELL alerts, particularly the XZERO.
Note: I have found the XQQE cross can also be quite good alert for BUY/SELL as well, particularly in direction of current trend. The XZERO I have found to be totally unreliable for BUY/SELL alerts.
This indicator should work on any currency pair, most chart timeframes and expiry in 3 to 6 candles for binary option trading. For hourly or longer charts expiry can be longer for binary options, or if available use standard forex trading techniques
Some Hints for using this indicator:
Avoid taking trades in non-trending market, this is normally indicated by a near Horizontal SMA50 line.
Avoid trading when all the moving averages are close together.
When trading 1min and 5min charts, expiry should set to 1-3 candles.
Avoid trading when market choppy, this is normally indicated by the fast EMA8 crossing the EMA20 back and forwards quickly.
High probability trades tend to occur when you get a XQQE followed by a XZERO and then BUY/SELL in the same direction of trend.
Don't trade near nor directly on any major market news (sometime better no trade day).
Please practise this system in DEMO first, before committing any real money. Be patient the more you practise the better and more confident you will be.
I hope you enjoy this indicator, it has proven very effective for me.

ZTLs Bar_TrendHere is an adaptation of TTM_Trend I coded. It's all pretty self explanatory. Aqua = buy and red = sell.
There's only one setting to tweak and it's the look-back for highest and lowest.
I have found that this indicator gives signals at almost identical areas to the TTM_Trend but tend to actually be a little more efficient (earlier buy/sell signals), although I haven't thoroughly back-tested it.
Enjoy!
Please comment below if you have any questions.

SAP121212 — Close vs VWAP + Optional RSI (Signals)This indicator combines Supertrend, VWAP with bands, and an optional RSI filter to generate Buy/Sell signals.
How it works
Supertrend Flip (ATR-based): Detects when trend direction changes (from bearish to bullish, or bullish to bearish).
VWAP Band Filter: Signals only trigger if the candle close is beyond the VWAP bands:
Buy = Supertrend flips up AND close > VWAP Upper Band
Sell = Supertrend flips down AND close < VWAP Lower Band
Optional RSI Filter:
Buy requires RSI < 20
Sell requires RSI > 80
Can be enabled/disabled in settings.
Features
Choice of VWAP band calculation mode: Standard Deviation or ATR.
Adjustable ATR/StDev length and multiplier for VWAP bands.
Toggle Supertrend, VWAP lines, and Buy/Sell labels.
Alerts included: add alerts on BUY or SELL conditions (use Once Per Bar Close to avoid intrabar signals).
Use
Works best on intraday or higher timeframes where VWAP is relevant.
Use the RSI filter for more selective signals.
Can be combined with your own stop-loss and risk management rules.
⚠️ Disclaimer: This script is for educational and research purposes only. It is not financial advice. Always test thoroughly and trade at your own risk.
SuperTrendSAP1212This indicator combines Supertrend, VWAP with bands, and an optional RSI filter to generate Buy/Sell signals.
How it works
Supertrend Flip (ATR-based): Detects when trend direction changes (from bearish to bullish, or bullish to bearish).
VWAP Band Filter: Signals only trigger if the candle close is beyond the VWAP bands:
Buy = Supertrend flips up AND close > VWAP Upper Band
Sell = Supertrend flips down AND close < VWAP Lower Band
Optional RSI Filter:
Buy requires RSI < 20
Sell requires RSI > 80
Can be enabled/disabled in settings.
Features
Choice of VWAP band calculation mode: Standard Deviation or ATR.
Adjustable ATR/StDev length and multiplier for VWAP bands.
Toggle Supertrend, VWAP lines, and Buy/Sell labels.
Alerts included: add alerts on BUY or SELL conditions (use Once Per Bar Close to avoid intrabar signals).
Use
Works best on intraday or higher timeframes where VWAP is relevant.
Use the RSI filter for more selective signals.
Can be combined with your own stop-loss and risk management rules.
⚠️ Disclaimer: This script is for educational and research purposes only. It is not financial advice. Always test thoroughly and trade at your own risk.

[blackcat] L2 Trend LinearityOVERVIEW
The L2 Trend Linearity indicator is a sophisticated market analysis tool designed to help traders identify and visualize market trend linearity by analyzing price action relative to dynamic support and resistance zones. This powerful Pine Script indicator utilizes the Arnaud Legoux Moving Average (ALMA) algorithm to calculate weighted price calculations and generate dynamic support/resistance zones that adapt to changing market conditions. By visualizing market zones through colored candles and histograms, the indicator provides clear visual cues about market momentum and potential trading opportunities. The script generates buy/sell signals based on zone crossovers, making it an invaluable tool for both technical analysis and automated trading strategies. Whether you're a day trader, swing trader, or algorithmic trader, this indicator can help you identify market regimes, support/resistance levels, and potential entry/exit points with greater precision.
FEATURES
Dynamic Support/Resistance Zones: Calculates dynamic support (bear market zone) and resistance (bull market zone) using weighted price calculations and ALMA smoothing
Visual Market Representation: Color-coded candles and histograms provide immediate visual feedback about market conditions
Smart Signal Generation: Automatic buy/sell signals generated from zone crossovers with clear visual indicators
Customizable Parameters: Four different ALMA smoothing parameters for various timeframes and trading styles
Multi-Timeframe Compatibility: Works across different timeframes from 1-minute to weekly charts
Real-time Analysis: Provides instant feedback on market momentum and trend direction
Clear Visual Cues: Green candles indicate bullish momentum, red candles indicate bearish momentum, and white candles indicate neutral conditions
Histogram Visualization: Blue histogram shows bear market zone (below support), aqua histogram shows bull market zone (above resistance)
Signal Labels: "B" labels mark buy signals (price crosses above resistance), "S" labels mark sell signals (price crosses below support)
Overlay Functionality: Works as an overlay indicator without cluttering the chart with unnecessary elements
Highly Customizable: All parameters can be adjusted to suit different trading strategies and market conditions
HOW TO USE
Add the Indicator to Your Chart
Open TradingView and navigate to your desired trading instrument
Click on "Indicators" in the top menu and select "New"
Search for "L2 Trend Linearity" or paste the Pine Script code
Click "Add to Chart" to apply the indicator
Configure the Parameters
ALMA Length Short: Set the short-term smoothing parameter (default: 3). Lower values provide more responsive signals but may generate more false signals
ALMA Length Medium: Set the medium-term smoothing parameter (default: 5). This provides a balance between responsiveness and stability
ALMA Length Long: Set the long-term smoothing parameter (default: 13). Higher values provide more stable signals but with less responsiveness
ALMA Length Very Long: Set the very long-term smoothing parameter (default: 21). This provides the most stable support/resistance levels
Understand the Visual Elements
Green Candles: Indicate bullish momentum when price is above the bear market zone (support)
Red Candles: Indicate bearish momentum when price is below the bull market zone (resistance)
White Candles: Indicate neutral market conditions when price is between support and resistance zones
Blue Histogram: Shows bear market zone when price is below support level
Aqua Histogram: Shows bull market zone when price is above resistance level
"B" Labels: Mark buy signals when price crosses above resistance
"S" Labels: Mark sell signals when price crosses below support
Identify Market Regimes
Bullish Regime: Price consistently above resistance zone with green candles and aqua histogram
Bearish Regime: Price consistently below support zone with red candles and blue histogram
Neutral Regime: Price oscillating between support and resistance zones with white candles
Generate Trading Signals
Buy Signals: Look for price crossing above the bull market zone (resistance) with confirmation from green candles
Sell Signals: Look for price crossing below the bear market zone (support) with confirmation from red candles
Confirmation: Always wait for confirmation from candle color changes before entering trades
Optimize for Different Timeframes
Scalping: Use shorter ALMA lengths (3-5) for 1-5 minute charts
Day Trading: Use medium ALMA lengths (5-13) for 15-60 minute charts
Swing Trading: Use longer ALMA lengths (13-21) for 1-4 hour charts
Position Trading: Use very long ALMA lengths (21+) for daily and weekly charts
LIMITATIONS
Whipsaw Markets: The indicator may generate false signals in choppy, sideways markets where price oscillates rapidly between support and resistance
Lagging Nature: Like all moving average-based indicators, there is inherent lag in the calculations, which may result in delayed signals
Not a Standalone Tool: This indicator should be used in conjunction with other technical analysis tools and risk management strategies
Market Structure Dependency: Performance may vary depending on market structure and volatility conditions
Parameter Sensitivity: Different markets may require different parameter settings for optimal performance
No Volume Integration: The indicator does not incorporate volume data, which could provide additional confirmation signals
Limited Backtesting: Pine Script limitations may restrict comprehensive backtesting capabilities
Not Suitable for All Instruments: May perform differently on stocks, forex, crypto, and futures markets
Requires Confirmation: Signals should always be confirmed with other indicators or price action analysis
Not Predictive: The indicator identifies current market conditions but does not predict future price movements
NOTES
ALMA Algorithm: The indicator uses the Arnaud Legoux Moving Average (ALMA) algorithm, which is known for its excellent smoothing capabilities and reduced lag compared to traditional moving averages
Weighted Price Calculations: The bear market zone uses (2low + close) / 3, while the bull market zone uses (high + 2close) / 3, providing more weight to recent price action
Dynamic Zones: The support and resistance zones are dynamic and adapt to changing market conditions, making them more responsive than static levels
Color Psychology: The color scheme follows traditional trading psychology - green for bullish, red for bearish, and white for neutral
Signal Timing: The signals are generated on the close of each bar, ensuring they are based on complete price action
Label Positioning: Buy signals appear below the bar (red "B" label), while sell signals appear above the bar (green "S" label)
Multiple Timeframes: The indicator can be applied to multiple timeframes simultaneously for comprehensive analysis
Risk Management: Always use proper risk management techniques when trading based on indicator signals
Market Context: Consider the overall market context and trend direction when interpreting signals
Confirmation: Look for confirmation from other indicators or price action patterns before entering trades
Practice: Test the indicator on historical data before using it in live trading
Customization: Feel free to experiment with different parameter combinations to find what works best for your trading style
THANKS
Special thanks to the TradingView community and the Pine Script developers for creating such a powerful and flexible platform for technical analysis. This indicator builds upon the foundation of the ALMA algorithm and various moving average techniques developed by technical analysis pioneers. The concept of dynamic support and resistance zones has been refined over decades of market analysis, and this script represents a modern implementation of these timeless principles. We acknowledge the contributions of all traders and developers who have contributed to the evolution of technical analysis and continue to push the boundaries of what's possible with algorithmic trading tools.

Decision Matrix [Cnagda] — Adaptive Multi-Signal Trading SystemDecision Matrix is a cutting-edge trading ecosystem that leverages the synergy of price action, volume dynamics, and key momentum indicators to create a powerful, real-time signal engine for traders.
Key Features:
Multi-Source Signal Fusion: Buy/Sell Power score, TWAP patterns, EMA/RSI crossovers, Volume zones — 7 layers of confirmation per candle.
Adaptive Intelligence: Dynamic lookback window, label-size, and threshold are auto-adjusted based on market volatility.
Volume Secrets Decoded: Adaptive ‘Low Volume’ (LV) candle detection reveals reversal and hidden accumulation patterns.
Order Block Auto-Zoning: Detect Demand & Supply zones to highlight boxes on the chart — market structure is instantly clear.
Heikin-Ashi Inspired Trend Mapping: Candle coloring based on trend intensity — clear visual feedback on every phase of a security.
Intelligent Pattern Recognition: 4-candle TWAP & Volume structures help to quickly spot rare reversals and momentum shifts.
Live Dashboard: Live Buy/Sell power on the chart, long/short trigger levels, multiple timeframes support — decision making lightning fast!
Use Cases:
Quick Reversal Detection
Momentum Entry/Exit Confirmation
False Breakout Filtering
Volume-Driven Structural Insights
Trailing Stop Placement based on True Demand/Supply Zones
What difference will it make?
Decision Matrix analyzes every uncertain market move from a multi-angle perspective to show where the market bias is right now, where is the best entry, when is the exit alert — and what is the real volume game behind every trend or even the most subtle reversal move — in just one glance!
Every curated visual & signal will give you pure information clarity and high-confidence trading advantage.

Candle Spread + ATR SMA Analysis
This indicator combines elements from two popular open-source scripts — Candle Range Compare
by @oldinvestor
and Objective Analysis of Spread (VSA)
by @Rin-Nin
— into a single tool for analyzing candle spreads (ranges and bodies) in relation to volatility benchmarks.
🔎 What It Does
Candle Decomposition:
Plots total candle ranges (high–low) in gray, for both up and down closes.
Plots up-close bodies (open–close) in white.
Plots down-close bodies in black.
This makes it easy to spot whether volatility comes from real price movement (body) or extended wicks.
ATR & SMA Volatility Bands:
Calculates ATR (Average True Range) and overlays it as a black line.
Plots four volatility envelopes derived from the SMA of the true range:
0.8× (blue, shaded)
1.3× (green)
1.8× (red)
3.0× (purple)
Colored fill zones highlight when candle spreads are below, within, or above key thresholds.
Visual Context:
Track expansion/contraction in spreads.
Compare bullish (white) vs bearish (black) bodies to gauge buying/selling pressure.
Identify when candles stretch beyond typical volatility ranges.
📈 How To Use It
VSA context: Wide down bars (black) beyond ATR bands may suggest supply; wide up bars (white) may indicate demand.
Trend confirmation: Expanding ranges above average thresholds (green/red/purple bands) often confirm momentum.
Reversal potential: Small bodies but large ranges (gray + wicks) frequently appear at turning points.
Volatility filter: Use ATR bands to filter trades — e.g., only act when candle ranges exceed 1.3× or 1.8× SMA thresholds.
🙏 Credits
This script is inspired by and combines ideas from:
Candle Range Compare
by @oldinvestor
Objective Analysis of Spread (VSA)
by @Rin-Nin
Big thanks to both authors for their valuable contributions to the TradingView community.
One thing I couldnt quite get to work is being able to display up and down wicks like in the candle range compare, so I just add that indicator to the chart as well, uncheck everything but the wick plots and there it is.

Cyclic Reversal Engine [AlgoPoint]Overview
Most indicators focus on price and momentum, but they often ignore a critical third dimension: time. Markets move in rhythmic cycles of expansion and contraction, but these cycles are not fixed; they speed up in trending markets and slow down in choppy conditions.
The Cyclic Reversal Engine is an advanced analytical tool designed to decode this rhythm. Instead of relying on static, lagging formulas, this indicator learns from past market behavior to anticipate when the current trend is statistically likely to reach its exhaustion point, providing high-probability reversal signals.
It achieves this by combining a sophisticated time analysis with a robust price-action confirmation.
How It Works: The Core Logic
The indicator operates on a multi-stage process to identify potential turning points in the market.
1. Market Regime Analysis (The Brain): Before analyzing any cycles, the indicator first diagnoses the current "personality" of the market. Using a combination of the ADX, Choppiness Index, and RSI, it classifies the market into one of three primary regimes:
- Trending: Strong, directional movement.
- Ranging: Sideways, non-directional chop.
- Reversal: An over-extended state (overbought/oversold) where a turn is imminent.
2. Adaptive Cycle Learning (The "Machine Learning" Aspect): This is the indicator's smartest feature. It constantly analyzes past cycles by measuring the bar-count between significant swing highs and swing lows. Crucially, it learns the average cycle duration for each specific market regime. For example, it learns that "in a strong trending market, a new swing low tends to occur every 35 bars," while "in a ranging market, this extends to 60 bars."
3. The Countdown & Timing Signal: The indicator identifies the last major swing high or low and starts a bar-by-bar countdown. Based on the current market regime, it selects the appropriate learned cycle length from its memory. When the bar count approaches this adaptive target, the indicator determines that a reversal is "due" from a timing perspective.
4. Price Confirmation (The Trigger): A signal is never generated based on timing alone. Once the timing condition is met (the cycle is "due"), the indicator waits for a final price-action confirmation. The default confirmation is the RSI entering an extreme overbought or oversold zone, signaling momentum exhaustion. The signal is only triggered when Time + Price Confirmation align.
How to Use This Indicator
- The Dashboard: The panel in the bottom-right corner is your command center.
- Market Regime: Shows the current market personality analyzed by the engine.
- Adaptive Cycle / Bar Count: This is the core of the indicator. It shows the target cycle length for the current regime (e.g., 50) and the current bar count since the last swing point (e.g., 45). The background turns orange when the bar count enters the "due zone," indicating that you should be on high alert for a reversal.
- BUY/SELL Signals: A label appears on the chart only when the two primary conditions are met:
The timing is right (Bar Count has reached the Adaptive Cycle target).
The price confirms exhaustion (RSI is in an extreme zone).
A BUY signal suggests a downtrend cycle is likely complete, and a SELL signal suggests an uptrend cycle is likely complete.
Key Settings
- Pivot Lookback: Controls the sensitivity of the swing point detection. Higher values will identify more significant, longer-term cycles.
- Market Regime Engine: The ADX, Choppiness, and RSI settings can be fine-tuned to adjust how the indicator classifies the market's personality.
- Require Price Confirmation: You can toggle the RSI confirmation on or off. It is highly recommended to keep it enabled for higher-quality signals.

TRADE ORBIT:Dual MACD + HEMA TrendThis indicator combines dual MACD histograms with a Harmonic EMA (HEMA) trend overlay to provide comprehensive trend analysis, buy/sell signals, and dynamic support/resistance zones.
Features:
Dual MACD System:
Background Coloring: Uses MACD(100,200,50) histogram to color the chart background:
Green = bullish momentum
Red = bearish momentum
Buy/Sell Signals: Uses MACD(34,144,9) histogram crossovers for trade signals:
BUY Signal: Histogram crosses above zero and background is green
SELL Signal: Histogram crosses below zero and background is red
Signals are plotted as labels on the chart.
HEMA Trend Overlay:
Uses short and long HEMA lines (default 20 & 40) to detect trend direction.
Colors bars dynamically based on trend:
Green = bullish
Red = bearish
Gray = neutral or indecisive
Provides gradient fill between HEMA lines to visually highlight trend strength.
Trend Boxes & Markers:
Bullish/bearish boxes highlight areas of potential support/resistance based on HEMA crossovers.
Markers (▲ / ▼) appear when the price interacts with trend boxes for easy visual confirmation.
Alerts:
HEMA crossovers (bullish/bearish)
Price tests of bullish/bearish boxes
Optionally, can add alerts for MACD BUY/SELL signals.
Visualization:
MACD histograms plotted as columns for reference
Dynamic bar colors reflecting HEMA trend
Combined view gives a multi-layered trend analysis on a single chart.
Use Case:
Ideal for traders who want to filter trades by overall trend (background MACD), time precise entries/exits (MACD signals), and confirm trend strength (HEMA overlay) in a single indicator.

Marubozu Detector with Dynamic SL/TP
Strategy Overview:
This indicator detects a "Marubozu" bullish pattern or a “Marubozu” bearish pattern to suggest potential buy and sell opportunities. It uses dynamic Stop Loss (SL) and Take Profit (TP) management, based on either market volatility (ATR) or liquidity zones.
This tool is intended for educational and informational purposes only.
Key Features:
Entry: Based on detecting Marubozu bullish or bearish candle pattern.
Exit: Targets are managed through ATR multiples or previous liquidity levels (swing highs or swing lows).
Smart Liquidity: Optionally identify deeper liquidity targets.
Full Alerts: Buy and Sell signals supported with customizable alerts.
Visualized Trades: Entry, SL, and TP levels are plotted on the chart.
User Inputs:
ATR Length, ATR Multipliers
Take Profit Mode (Liquidity/ATR)
Swing Lookback and Strength
Toggleable Buy/Sell alerts
All Time Frames
📖 How to Use:
Add the Indicator:
Apply the script to your chart from the TradingView indicators panel.
Look for Buy Signals:
A buy signal is triggered when the script detects a "Marubozu" bullish pattern.
Entry, Stop Loss, and Take Profit levels are plotted automatically.
Look for Sell Signals:
A Sell signal is triggered when the script detects a "Marubozu" bearish pattern.
Entry, Stop Loss, and Take Profit levels are plotted automatically.
Choose Take Profit Mode:
ATR Mode: TP is based on a volatility target.
Liquidity Mode: TP is based on past swing highs.
Set Alerts (Optional):
Enable Buy/Sell alerts in the settings to receive real-time notifications.
Practice First:
Always backtest and paper trade before live use.
📜 Disclaimer:
This script does not offer financial advice.
No guarantees of profit or performance are made.
Use in demo accounts or backtesting first.
Always practice proper risk management and seek advice from licensed professionals if needed.
✅ Script Compliance:
This script is designed in full accordance with TradingView’s House Rules for educational tools.
No financial advice is provided, no performance is guaranteed, and users are encouraged to backtest thoroughly.

Hilly's Advanced Crypto Scalping Strategy - 5 Min ChartTo determine the "best" input parameters for the Advanced Crypto Scalping Strategy on a 5-minute chart, we need to consider the goals of optimizing for profitability, minimizing false signals, and adapting to the volatile nature of cryptocurrencies. The default parameters in the script are a starting point, but the optimal values depend on the specific cryptocurrency pair, market conditions, and your risk tolerance. Below, I'll provide recommended input values based on common practices in crypto scalping, along with reasoning for each parameter. I’ll also suggest how to fine-tune them using TradingView’s backtesting and optimization tools.
Recommended Input Parameters
These values are tailored for a 5-minute chart for liquid cryptocurrencies like BTC/USD or ETH/USD on exchanges like Binance or Coinbase. They aim to balance signal frequency and accuracy for day trading.
Fast EMA Length (emaFastLen): 9
Reasoning: A 9-period EMA is commonly used in scalping to capture short-term price movements while remaining sensitive to recent price action. It reacts faster than the default 10, aligning with the 5-minute timeframe.
Slow EMA Length (emaSlowLen): 21
Reasoning: A 21-period EMA provides a good balance for identifying the broader trend on a 5-minute chart. It’s slightly longer than the default 20 to reduce noise while confirming the trend direction.
RSI Length (rsiLen): 14
Reasoning: The default 14-period RSI is a standard choice for momentum analysis. It works well for detecting overbought/oversold conditions without being too sensitive on short timeframes.
RSI Overbought (rsiOverbought): 75
Reasoning: Raising the overbought threshold to 75 (from 70) reduces false sell signals in strong bullish trends, which are common in crypto markets.
RSI Oversold (rsiOversold): 25
Reasoning: Lowering the oversold threshold to 25 (from 30) filters out weaker buy signals, ensuring entries occur during stronger reversals.
MACD Fast Length (macdFast): 12
Reasoning: The default 12-period fast EMA for MACD is effective for capturing short-term momentum shifts in crypto, aligning with scalping goals.
MACD Slow Length (macdSlow): 26
Reasoning: The default 26-period slow EMA is a standard setting that works well for confirming momentum trends without lagging too much.
MACD Signal Smoothing (macdSignal): 9
Reasoning: The default 9-period signal line is widely used and provides a good balance for smoothing MACD crossovers on a 5-minute chart.
Bollinger Bands Length (bbLen): 20
Reasoning: The default 20-period Bollinger Bands are effective for identifying volatility breakouts, which are key for scalping in crypto markets.
Bollinger Bands Multiplier (bbMult): 2.0
Reasoning: A 2.0 multiplier is standard and captures most price action within the bands. Increasing it to 2.5 could reduce signals but improve accuracy in highly volatile markets.
Stop Loss % (slPerc): 0.8%
Reasoning: A tighter stop loss of 0.8% (from 1.0%) suits the high volatility of crypto, helping to limit losses on false breakouts while keeping risk manageable.
Take Profit % (tpPerc): 1.5%
Reasoning: A 1.5% take-profit target (from 2.0%) aligns with scalping’s goal of capturing small, frequent gains. Crypto markets often see quick reversals, so a smaller target increases the likelihood of hitting profits.
Use Candlestick Patterns (useCandlePatterns): True
Reasoning: Enabling candlestick patterns (e.g., engulfing, hammer) adds confirmation to signals, reducing false entries in choppy markets.
Use Volume Filter (useVolumeFilter): True
Reasoning: The volume filter ensures signals occur during high-volume breakouts, which are more likely to sustain in crypto markets.
Signal Arrow Size (signalSize): 2.0
Reasoning: Increasing the arrow size to 2.0 (from 1.5) makes buy/sell signals more visible on the chart, especially on smaller screens or volatile price action.
Background Highlight Transparency (bgTransparency): 85
Reasoning: A slightly higher transparency (85 from 80) keeps the background highlights subtle but visible, avoiding chart clutter.
How to Apply These Parameters
Copy the Script: Use the Pine Script provided in the previous response.
Paste in TradingView: Open TradingView, go to the Pine Editor, paste the code, and click "Add to Chart."
Set Parameters: In the strategy settings, manually input the recommended values above or adjust them via the input fields.
Test on a 5-Minute Chart: Apply the strategy to a liquid crypto pair (e.g., BTC/USDT, ETH/USDT) on a 5-minute chart.
Fine-Tuning for Optimal Performance
To find the absolute best parameters for your specific trading pair and market conditions, use TradingView’s Strategy Tester and optimization features:
Backtesting:
Run the strategy on historical data for your chosen pair (e.g., BTC/USDT on Binance).
Check metrics like Net Profit, Profit Factor, Win Rate, and Max Drawdown in the Strategy Tester.
Focus on a sample period of at least 1–3 months to capture various market conditions (bull, bear, sideways).
Parameter Optimization:
In the Strategy Tester, click the settings gear next to the strategy name.
Enable optimization for key inputs like emaFastLen (test range: 7–12), emaSlowLen (15–25), slPerc (0.5–1.5), and tpPerc (1.0–3.0).
Run the optimization to find the combination with the highest net profit or best Sharpe ratio, but avoid over-optimization (curve-fitting) by testing on out-of-sample data.
Market-Specific Adjustments:
Volatile Pairs (e.g., DOGE/USDT): Use tighter stop losses (e.g., 0.5–0.7%) and smaller take-profit targets (e.g., 1.0–1.2%) to account for rapid price swings.
Stable Pairs (e.g., BTC/USDT): Slightly wider stop losses (e.g., 1.0–1.2%) and take-profit targets (e.g., 1.8–2.5%) may work better.
Trending Markets: Increase emaSlowLen (e.g., to 25–30) to follow stronger trends.
Choppy Markets: Tighten bbMult (e.g., to 1.8) and lower rsiOverbought/rsiOversold (e.g., to 70/30) to filter noise.
Forward Testing:
After backtesting, run the strategy in real-time on a demo account for 1–2 weeks to validate performance under current market conditions.
Important Notes
No Universal "Best" Numbers: Optimal parameters vary by crypto pair, exchange, and market conditions (e.g., bull vs. bear market). The suggested values are a starting point based on common scalping practices.
Risk Management: Never risk more than 1–2% of your account per trade. Adjust position sizing in TradingView’s strategy settings to align with your risk tolerance.
Market Volatility: Crypto markets are highly volatile. Test the strategy on your specific pair and adjust parameters if signals are too frequent or too rare.
Not Financial Advice: This is an educational tool. Backtest thoroughly and use a demo account before trading with real funds.
If you want me to generate a chart showing backtest performance for specific parameters or to tweak the script further (e.g., adding more indicators or adjusting signal logic), let me know!can you add clear buy ans sell signs above the candles in this codeTo add clear buy and sell signals above the candles in the provided Pine Script, I'll modify the existing code to include prominent text labels directly above (for sell signals) and below (for buy signals) the candles. These labels will be larger, color-coded, and positioned to avoid clutter, ensuring they are easily visible on the chart. The core strategy logic (EMA, RSI, MACD, Bollinger Bands, candlestick patterns, and volume filter) will remain unchanged, and I'll reuse the same artifact_id since this is an update to the previous script.AdvancedCryptoScalpingStrategy.pinex-pine

ICT FVG Buy/Sell SignalsThis bot is built on ICT (Inner Circle Trader) concepts such as:
Fair Value Gaps (FVGs) – imbalance zones between candles.
Consequent Encroachment (CE) – the midpoint of a gap.
Premium / Discount Arrays – dealing ranges split into premium (sell-side) and discount (buy-side) zones.
Displacement candles – strong impulsive moves that confirm intent.
The bot scans for FVGs, marks CE levels, and waits for price to return to these levels.
When price revisits a valid FVG zone with displacement confirmation and in the correct PD array, the bot generates a BUY or SELL signal.
✅ Signal Rules
Buy Signal
Price trades back into a Bullish FVG.
Current bar shows bullish displacement (large bullish body relative to ATR).
Price is in discount territory of the current dealing range (if PD filter is enabled).
Close is above the CE line of the FVG.
Sell Signal
Price trades back into a Bearish FVG.
Current bar shows bearish displacement.
Price is in premium territory of the current dealing range.
Close is below the CE line of the FVG.
🎯 What You’ll See on the Chart
Green “BUY” labels below candles when long signals trigger.
Red “SELL” labels above candles when short signals trigger.
Shaded background:
Red = Premium zone (sell side).
Teal = Discount zone (buy side).
Yellow line = dealing range midpoint (equilibrium).
Dots on CE lines = midpoints of the latest bullish/bearish FVG.
🔔 Alerts
ICT Buy → Triggers when a bullish setup confirms.
ICT Sell → Triggers when a bearish setup confirms.
You can connect these alerts to:
TradingView notifications.
Webhooks (for brokers or bots like MetaTrader, NinjaTrader, or Discord).
⚙️ Settings
Swing length – how many bars to use when detecting swing highs/lows for the dealing range.
Use PD filter – toggle ON/OFF for requiring discount/premium alignment.
Displacement ATR multiple – how strong the candle body must be compared to ATR to count as a displacement.
ATR length – used for displacement filter.
📈 Supported Markets
Works on all symbols and timeframes.
Commonly applied to:
NASDAQ (NQ, QQQ)
S&P500 (ES, SPX, SPY)
Forex pairs
Crypto (BTC, ETH, etc.)
⚠️ Disclaimer
This bot is for educational purposes only. It does not guarantee profits and should be tested on demo accounts first.
Always apply proper risk management before trading live.

EMA20 Cross Strategy with countertrades and signalsEMA20 Cross Strategy Documentation
Overview
The EMA20 Cross Strategy with Counter-Trades and Instant Signals is a Pine Script (version 6) trading strategy designed for the TradingView platform. It implements an Exponential Moving Average (EMA) crossover system to generate buy and sell signals, with optional trend filtering, session-based trading, instant signal processing, and visual/statistical feedback. The strategy supports counter-trades (closing opposing positions before entering new ones) and operates with a fixed trade size in EUR.
Features
EMA Crossover Mechanism:
Uses a short-term EMA (configurable length, default: 1) and a long-term EMA (default: 20) to detect crossovers.
A buy signal is generated when the short EMA crosses above the long EMA.
A sell signal is generated when the short EMA crosses below the long EMA.
Instant Signals:
If enabled (useInstantSignals), signals are based on the current price crossing the short EMA, rather than waiting for the candle close.
This allows faster trade execution but may increase sensitivity to price fluctuations.
Trend Filter:
Optionally filters trades based on the trend direction (useTrendFilter).
Long trades are allowed only when the short EMA (or price, for instant signals) is above the long EMA.
Short trades are allowed only when the short EMA (or price) is below the long EMA.
Session Filter:
Restricts trading to specific market hours (sessionStart, default: 09:00–17:00) if enabled (useSessionFilter).
Ensures trades occur only during active market sessions, reducing exposure to low-liquidity periods.
Customizable Timeframe:
The EMA calculations can use a higher timeframe (e.g., 5m, 15m, 1H, 4H, 1D, default: 1H) via request.security.
This allows the strategy to base signals on longer-term trends while operating on a shorter-term chart.
Trade Management:
Fixed trade size of €100,000 per trade (tradeAmount), with a maximum quantity cap (maxQty = 10,000) to prevent oversized trades.
Counter-trades: Closes short positions before entering a long position and vice versa.
Trades are executed with a minimum quantity of 1 to ensure valid orders.
Visualization:
EMA Lines: The short EMA is colored based on the last signal (green for buy, red for sell, gray for neutral), and the long EMA is orange.
Signal Markers: Displays buy/sell signals as arrows (triangles) above/below candles if enabled (showSignalShapes).
Background/Candle Coloring: Optionally colors the chart background or candles green (bullish) or red (bearish) based on the trend (useColoredBars).
Statistics Display:
If enabled (useStats), a label on the chart shows:
Total closed trades
Open trades
Win rate (%)
Number of winning/losing trades
Profit factor (gross profit / gross loss)
Net profit
Maximum drawdown
Configuration Inputs
EMA Short Length (emaLength): Length of the short-term EMA (default: 1).
Trend EMA Length (trendLength): Length of the long-term EMA (default: 20).
Enable Trend Filter (useTrendFilter): Toggles trend-based filtering (default: true).
Color Candles (useColoredBars): Colors candles instead of the background (default: true).
Enable Session Filter (useSessionFilter): Restricts trading to specified hours (default: false).
Trading Session (sessionStart): Defines trading hours (default: 09:00–17:00).
Show Statistics (useStats): Displays performance stats on the chart (default: true).
Show Signal Arrows (showSignalShapes): Displays buy/sell signals as arrows (default: true).
Use Instant Signals (useInstantSignals): Generates signals based on live price action (default: false).
EMA Timeframe (emaTimeframe): Timeframe for EMA calculations (options: 5m, 15m, 1H, 4H, 1D; default: 1H).
Strategy Logic
Signal Generation:
Standard Mode: Signals are based on EMA crossovers (short EMA crossing long EMA) at candle close.
Instant Mode: Signals are based on the current price crossing the short EMA, enabling faster reactions.
Trade Execution:
On a buy signal, closes any short position and opens a long position.
On a sell signal, closes any long position and opens a short position.
Position size is calculated as the minimum of €100,000 or available equity, divided by the current price, capped at 10,000 units.
Filters:
Trend Filter: Ensures trades align with the trend direction (if enabled).
Session Filter: Restricts trades to user-defined market hours (if enabled).
Visual Feedback
EMA Lines: Provide a clear view of the short and long EMAs, with the short EMA’s color reflecting the latest signal.
Signal Arrows: Large green triangles (buy) below candles or red triangles (sell) above candles for easy signal identification.
Chart Coloring: Highlights bullish (green) or bearish (red) trends via background or candle colors.
Statistics Label: Displays key performance metrics in a label above the chart for quick reference.
Usage Notes
Initial Capital: €100,000 (configurable via initial_capital).
Currency: EUR (set via currency).
Order Processing: Orders are processed at candle close (process_orders_on_close=true) unless instant signals are enabled.
Dynamic Requests: Allows dynamic timeframe adjustments for EMA calculations (dynamic_requests=true).
Platform: Designed for TradingView, compatible with any market supported by the platform (e.g., stocks, forex, crypto).
Example Use Case
Scenario: Trading on a 5-minute chart with a 1-hour EMA timeframe, trend filter enabled, and session filter set to 09:00–17:00.
Behavior: The strategy will:
Calculate EMAs on the 1-hour timeframe.
Generate buy signals when the short EMA crosses above the long EMA (and price is above the long EMA).
Generate sell signals when the short EMA crosses below the long EMA (and price is below the long EMA).
Execute trades only during 09:00–17:00.
Display green/red candles and performance stats on the chart.
Limitations
Instant Signals: May lead to more frequent signals, increasing the risk of false positives in volatile markets.
Fixed Trade Size: Does not adjust dynamically based on market conditions beyond equity and max quantity limits.
Session Filter: Simplified and may not account for complex session rules or holidays.
Statistics: Displayed on-chart, which may clutter the view in smaller charts.
Customization
Adjust emaLength and trendLength to suit different market conditions (e.g., shorter for scalping, longer for swing trading).
Toggle useInstantSignals for faster or more stable signal generation.
Modify sessionStart to align with specific market hours.
Disable useStats or showSignalShapes for a cleaner chart.
This strategy is versatile for both manual and automated trading, offering flexibility for various markets and trading styles while providing clear visual and statistical feedback.

MACD Positive & Negative AlertThe MACD (Moving Average Convergence Divergence) is a momentum and trend-following indicator that helps traders identify the strength and direction of a trend, spot potential reversals, and fine-tune entry/exit timing.
Core Components
- MACD Line:
The difference between the 12-period and 26-period EMA (Exponential Moving Averages). This line highlights shifts in momentum and identifies the prevailing trend direction.
- Signal Line:
A 9-period EMA of the MACD line, acting as a trigger for buy/sell signals. When the MACD line crosses above the signal line, it suggests a bullish signal; when it crosses below, it suggests a bearish one.
- Histogram:
Shows the difference between the MACD line and the signal line as a bar graph. The histogram helps traders gauge the strength of the momentum and can warn of possible reversals. A rapidly growing histogram means strengthening momentum, while a shrinking one indicates weakening momentum.
Main Uses
- Trend Identification:
A positive MACD value typically signals a bullish trend, while a negative value signals a bearish trend.
- Momentum Analysis:
Divergences between MACD and price can warn of upcoming reversals. Increasing MACD histogram bars confirm strong momentum; shrinking bars suggest consolidation or reversal.
- Signal Generation:
Crossovers between the MACD line and the signal line generate trade signals—bullish (buy) if the MACD moves above the signal, bearish (sell) if it falls below l.
Example Interpretation
- MACD Crossover:
If the MACD line crosses above the signal line, it's often considered a buy signal; a cross below is a sell signal.
- Zero Line Cross:
If the MACD histogram moves from below zero to above, this is considered a bullish momentum shift; above zero to below is a bearish move.
The MACD is most effective in trending markets and should ideally be used alongside additional indicators for robust trading decisions.

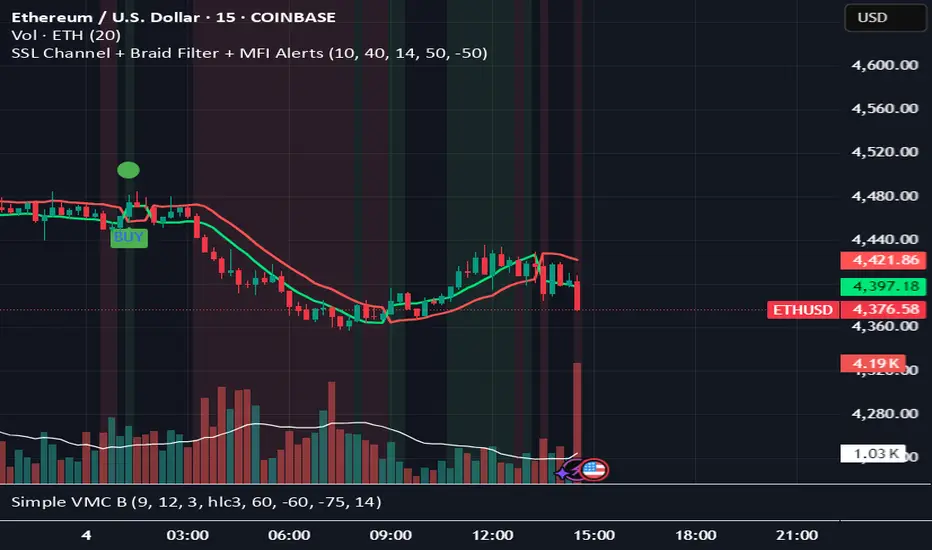
SSL CHANNEL 2.0SSL Channel + Braid Filter + MFI Alerts (TanTechTrades™)
This indicator combines three confirmation tools — SSL Channel, Braid Filter, and Money Flow Index (MFI) — to generate precise buy/sell alerts.
🔹 Features
SSL Channel: Trend direction based on moving averages of highs and lows
Braid Filter: Confirms trend strength via EMA separation and volatility filter
MFI: Volume-adjusted momentum for validation of long/short entries
Alerts for both long and short signals
Background coloring for visual Braid Filter confirmation
Signal markers on the chart (BUY/SELL labels + colored circles)
🔹 How It Works
Long Signal: SSL bullish crossover + Braid Filter green + MFI above threshold
Short Signal: SSL bearish crossunder + Braid Filter red + MFI below threshold
Plots dynamic trend lines and color-coded backgrounds to reinforce signals visually
This multi-indicator system helps reduce false signals by requiring trend, momentum, and volume confirmation before entries.
⚠️ Disclaimer: Educational purposes only. Not financial advice.
SMA Crossover High/Low LinesSMA Crossover High/Low Lines (@version=5)
Purpose
This indicator plots horizontal lines and optional price labels on the high and low of candles where the price crosses a Simple Moving Average (SMA). It helps identify buy/sell signals visually on the chart.
Inputs
smaLength – Length of the SMA (default: 50).
showType – Which crossovers to show: "Both", "Buy Only", or "Sell Only".
lineLength – How many bars the horizontal line extends (default: 10).
showPriceLabels – Whether to show price labels at crossover points (true/false).
Logic
SMA Calculation – Computes a simple moving average of the closing price.
Crossover Detection:
crossUp → price crosses above SMA (buy signal).
crossDown → price crosses below SMA (sell signal).
Draw Horizontal Lines – At candle high and low of crossover:
Green for buy (crossUp)
Red for sell (crossDown)
Lines extend for lineLength bars
Optional Labels – Shows the high/low price at the end of the horizontal line if showPriceLabels is true.
Visualization
SMA line plotted in blue.
Buy crossovers → green horizontal lines and labels.
Sell crossovers → red horizontal lines and labels.
In short:
This indicator highlights buy/sell points where price crosses the SMA by marking candle highs/lows with colored lines and optional price labels for easy visual reference.

Triple Tap Sniper Triple Tap Sniper v3 – EMA Retest Precision System
Triple Tap Sniper is a precision trading tool built around the 21, 34, and 55 EMAs, designed to capture high-probability retests after EMA crosses. Instead of chasing the first breakout candle, the system waits for the first pullback into the EMA21 after a trend-confirming cross — the spot where professional traders often enter.
🔑 Core Logic
EMA Alignment → Trend defined by EMA21 > EMA34 > EMA55 (bullish) or EMA21 < EMA34 < EMA55 (bearish).
Cross Detection → Signals are only armed after a fresh EMA cross.
Retest Entry → Buy/Sell signals fire only on the first retest of EMA21, with trend still intact.
Pro Filters →
📊 Higher Timeframe Confirmation: Aligns signals with larger trend.
📈 ATR Volatility Filter: Blocks weak signals in low-vol chop.
📏 EMA Spread Filter: Ignores tiny “fake crosses.”
🕯️ Price Action Filter: Requires a proper wick rejection for valid entries.
🚀 Why Use Triple Tap Sniper?
✅ Filters out most false signals from sideways markets.
✅ Focuses only on clean trend continuations after pullbacks.
✅ Beginner-friendly visuals (Buy/Sell labels) + alert-ready for automation.
✅ Flexible: works across multiple timeframes & asset classes (stocks, crypto, forex).
⚠️ Notes
This is a signal indicator, not a full strategy. For backtesting and optimization, convert to a strategy and adjust filters per market/timeframe.
No indicator guarantees profits — use with sound risk management.

Elliott Wave Rule EngineWhat this tool does
The indicator scans price for two concurrent swing structures—a Small (shorter-degree) and a Large (higher-degree) set—then applies an Elliott/NeoWave rule engine to the most recent 5-swing motive (1-2-3-4-5) or 3-swing corrective (A-B-C). It produces:
Blue lines for Small swings and Orange lines for Large swings.
A rule dashboard (optional) showing PASS/FAIL/WARN for core rules & guidelines.
Buy/Sell labels when (a) a valid motive completes and (b) loop “consensus,” alignment, and scoring gates are satisfied.
Reading the chart
Small swings: thin blue segments, built from your Small settings.
Large swings: thicker orange segments, from your Large settings.
Background tint: faint green when a motive (impulse/diagonal) is valid right now on Small.
Labels (if enabled):
“1…5” or “A-B-C” markers on the latest detected structure.
Buy/Sell label at the last pivot when all gates pass; text may include a score %.
How it works
For both Small and Large degrees the script:
- Loops over all (left, right) combinations you specify (e.g., Small Left = 3..6, Right = 0..0) and calls ta.pivothigh/low.
- Aggregates the results:
- Keeps the most extreme pivot found in the loop (highest high or lowest low) that’s newer than the last accepted swing.
- Gates acceptance by minimum % change versus the last opposite swing (inside the loop) and a post-aggregation filter (Small Minimum swing %, Large Minimum swing %).
- Merges back-to-back same-type swings (HH or LL) by keeping only the more extreme one.
- Keeps only the last N=lookbackWaves swings (default 100).
- Consensus (used for signals) comes from the loop counts:
- sBuyConsensus = small L-count / total-combos (bullish bias)
- sSellConsensus = small H-count / total-combos (bearish bias)
(and the same for Large). This is a data-driven “how many combos agreed” measure.
2) Rule engine (Impulse/Diagonal vs. Corrective)
When there are at least 6 Small swings, the engine tests 1-2-3-4-5:
Hard rules (must pass for an Impulse):
- Wave-2 not > 100% of Wave-1 (no retrace beyond start of W1).
- Wave-3 not the shortest among 1,3,5.
- Wave-4 doesn’t overlap Wave-1 (if it does, structure may be a Diagonal).
- Diagonal eligibility: Rules 1 & 2 pass but Rule 3 fails ⇒ eligible as a Diagonal (
Guidelines (7 checks, count toward a threshold you set):
- W2 retraces a Fib level (within ±fibTol).
- W4 retraces a Fib level (within ±fibTol).
- W3 strongest momentum (speed = |Δprice| / bars).
- Alternation: W2 vs W4 have meaningfully different “sharpness” (price per bar), threshold altSlopeThr.
- Proportion (Price): |W1| and |W3| within propTolP× each other.
- Proportion (Time): W1W3 and W2W4 durations within propTolT×.
- W5 weaker than W3 (momentum divergence proxy).
A Motive is valid if:
- Impulse: all 3 hard rules pass and guideline passes ≥ Min guideline passes.
- Diagonal: diagonal-eligible and guideline passes ≥ Min guideline passes.
- if motive fails, the engine still evaluates ABC as Zigzag and Flat to populate the table:
- Zigzag: B shallower than ~0.618A; C ≈ A or 1.618A (±fibTol).
- Flat: B ≥ ~0.9A; expanded flat if B > 1.0A and C in *A; “running” note if C < A.
3) Signal logic (consensus-gated & scored)
Signals fire only on new Small pivots and only if a Small motive just validated:Direction comes from the motive’s W1 (up = bull, down = bear).
Consensus checks (from the loop):
Use Sell consensus if the last pivot is a High, or Buy consensus if it’s a Low.Require it ≥ Min SMALL loop consensus and ahead of the opposite side by at least Min consensus margin.If you also require Large quality: check the corresponding Large consensus ≥ Min LARGE loop consensus.
Alignment: If Require small/large directional alignment is ON, Small and Large directions must match (or the Large motive must be complete).
Score:
- If Large not required: finalScore = smallConsensus × smallQuality.
- If Large required: finalScore = smallConsensus × smallQuality × largeQuality.
- Need finalScore ≥ Min final score.
When all gates pass, you’ll see “Buy xx%” or “Sell xx%” at the pivot.
Inputs (explained):
- Smaller Wave Swing Detection (Looped)
- Small Left Min / Max (default 3..6): ta.pivot* left widths to scan.
- Small Right Min / Max (default 0..0): right widths to scan (0 = earliest confirmation).
- Small Minimum swing % (post-aggregation) (0.3%): filters out tiny swings after the loop.
- Larger Wave Swing Detection (Looped)
- Large Left Min / Max (100..200) and Right Min/Max (0..0): higher-degree scan (defaults are big; adjust for intraday).
- Large Minimum swing % (post-aggregation) (1.5%).
- Loop Filters (inside the loop)
- Small loop min % change (0.20%): a candidate pivot counts only if move vs. last opposite Small swing ≥ this.
- Large loop min % change (1.50%): same idea for Large.
Rule Engine Tolerances
- Fibonacci tolerance (±%) (0.05 = 5%): closeness to Fib levels.
-Same-degree TIME proportion max (x) (2.00×) and PRICE proportion max (x) (3.00×).
- Alternation slope ratio threshold (0.10): higher = stricter alternation.
- Min guideline passes (0–7) (5): threshold for motive validity.
- Signal Probability (Loop Consensus)
- Min SMALL loop consensus (0.60).
- Min LARGE loop consensus (0.50) (used only if Large validation matters).
- Min consensus margin vs opposite (0.10): e.g., 0.60 vs 0.45 fails (margin 0.15 passes).
Require LARGE 1–5 valid (or diagonal) for signal (off by default).
Min final score (0.20): gate on the composite score.
Annotate label with score % (on).
WARN (orange): guideline not met—pattern can still be valid if total passes ≥ Min guideline passes.
FAQ
Q: Why did I get a diagonal instead of an impulse?
A: Wave-4 overlapped Wave-1 (Rule 3). If Rules 1 & 2 pass and guidelines meet your minimum, it’s eligible as a Diagonal.
Q: Where do Buy/Sell labels come from?
A: Only after a valid Small motive at a new pivot, and only if consensus, alignment, and final score gates pass (per your settings).
Q: It “missed” a wave in hindsight.
A: Pivots require right bars to confirm; extremely tight settings can filter that swing; adjust Small min % or ranges.
Q: Are there repaints?
A: No, It uses standard pivot confirmation; until a pivot is confirmed, recent swings can evolve. After confirmation, lines/labels are stable.
Limitations & disclaimers
Elliott/NeoWave rules are heuristics; markets are messy. Treat outputs as structured context, not certainty.
Consensus is pattern-scan agreement, not probability of profit Not investment advice; always couple with risk management.
